In an actuarial valuation, future liabilities are estimated using assumptions, hence they form a very important part of any actuarial report. Assumptions are categorized as financial or demographic assumptions. Salary increment rate and discount rate are financial assumptions whereas attrition rate/withdrawal rate, retirement age and mortality are demographic assumptions. These assumptions are typically set by the companies based on their historical data, future expectations, and management’s best estimate. The company may consider past data of 2-3 years to set them.
We conducted a detailed study of Gratuity actuarial assumption patterns chosen by companies for the FY 21-22. We have considered data of FY 21-22 only since almost all businesses were hit by the COVID 19 pandemic in FY 19-20 and 20-21. Many companies had changed their assumptions to suit the situation of the business, for example- many companies made salary increment rate for the next year equal to 0% while some revised assumption for next 1-3 years. We have skipped these two financial years’ data for the study as they may be considered as anomalous years. The database used for the purpose of this study comprises of our various clients from all over India, the majority are from Maharashtra, Karnataka, Tamil Nadu and Delhi. The sample size for the study was approximately 1,800 companies. We have also taken utmost care to exclude clients’ data with whom we have signed non-disclosure agreements.
Disclaimer: This study is built on the client database of Ranadey Professional Services Private Limited as at 31st March 2022. We don’t claim that the following results necessarily represent the trends in the industry. This report is proprietary information of Ranadey Professional Services. This is to be held strictly confidential and no part of the report should be reproduced or shared without the prior permission of Ranadey Professional Services.
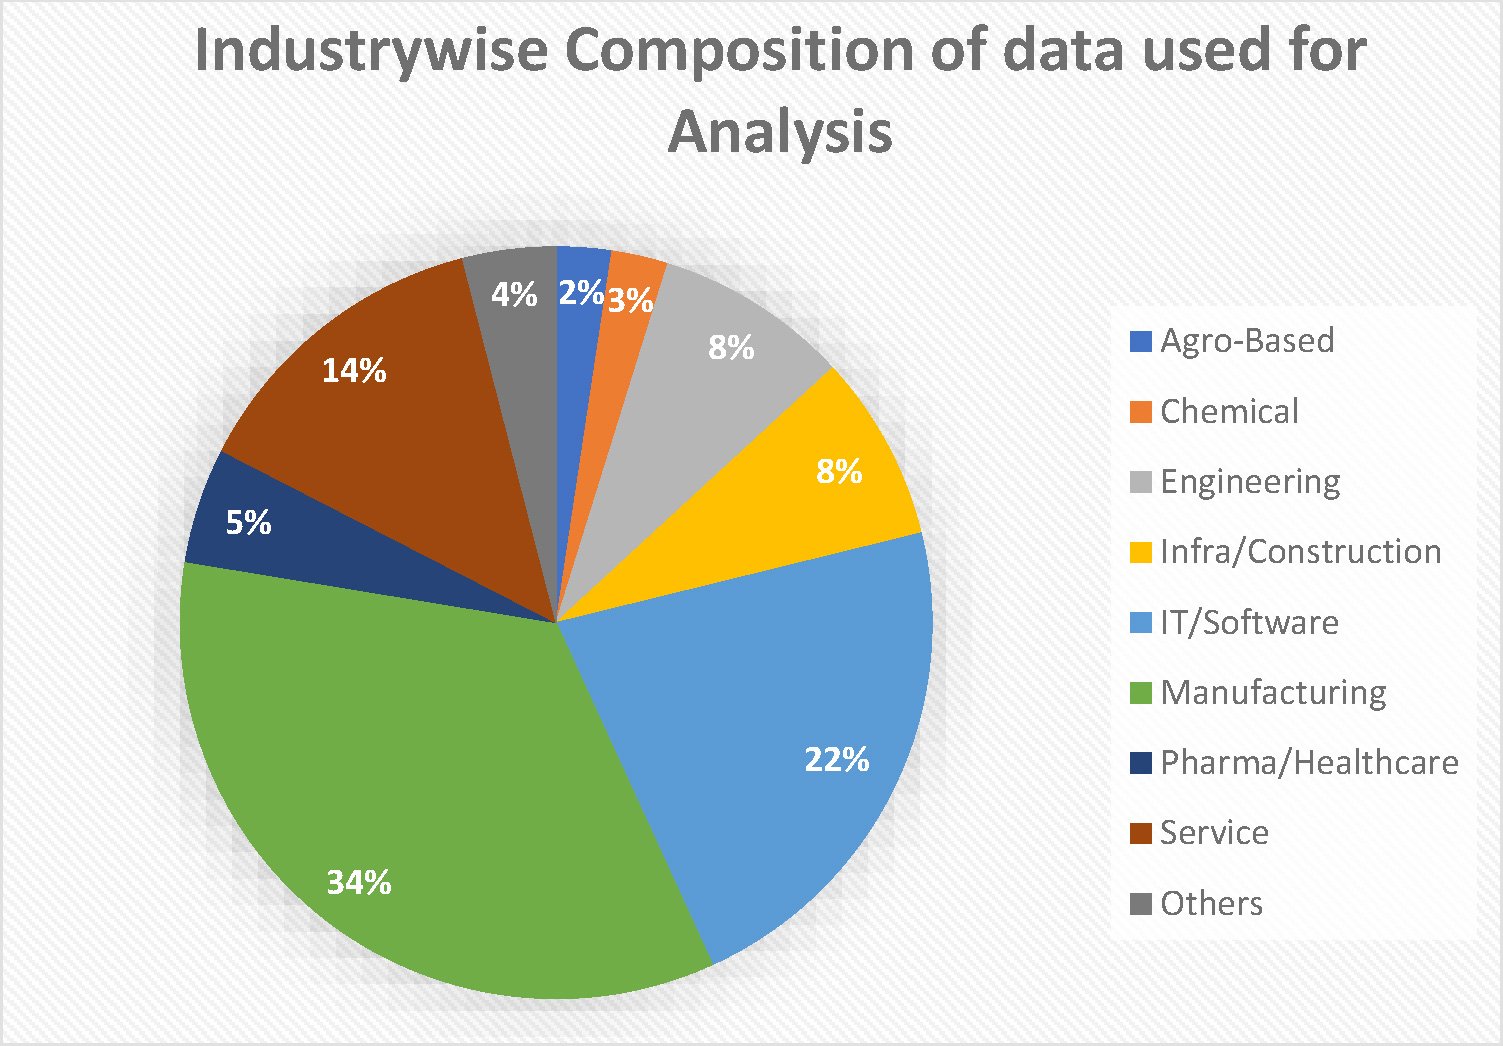
Figure 1 depicts split of the database between major industry types. Almost 50% of the data is represented by manufacturing and IT industries. Sectors like education, finance/banking and hospitality are considered under Service category. Sectors like Media, Packaging, Jewellery, Retails stores are included in Others category.
Figure 1
1. FINANCIAL ASSUMPTIONS
Salary Increment Assumption
Salary increment rate assumption is used to project the amount of the benefit payment. It should be set by considering inflation, seniority, promotion and other relevant factors such as supply and demand in the employment market and the history regarding salary increases.
Figures 2 and 3 illustrate the distribution of salary increment assumption used and the actual salary increment which happened in various industries respectively. Actual salary increments have been arrived at by taking average of all employees’ increments in the company. As may be deciphered from
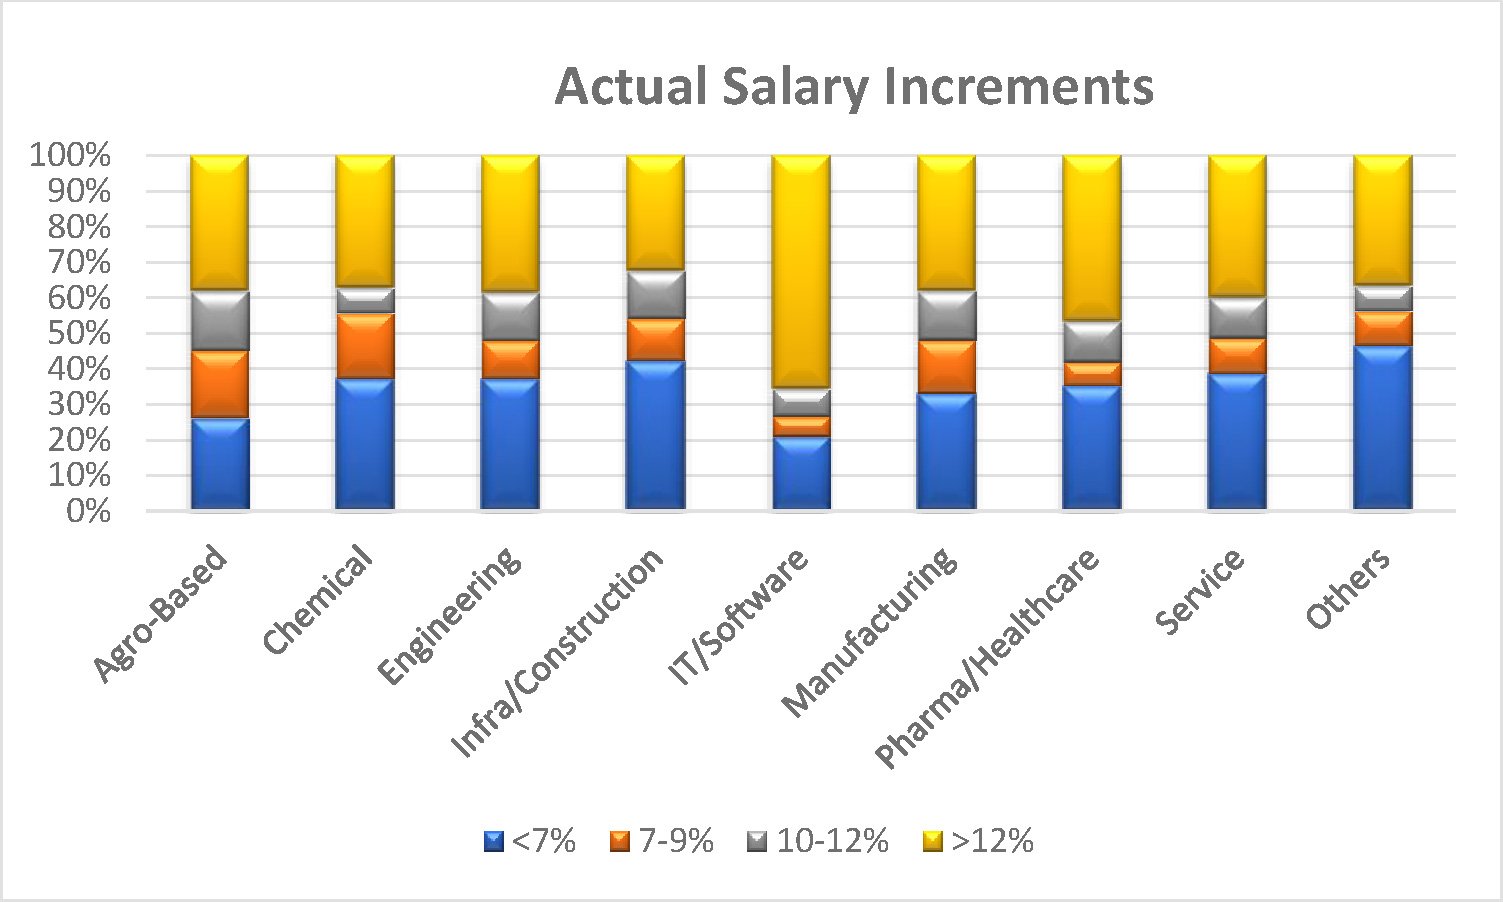
Figure 2, the average salary increment rate assumption used by majority companies for the valuation ranges between 7-9% p.a. Figure 3 depicts the actual salary increment which is somewhat higher than average assumption used for the valuation.
Figure 2
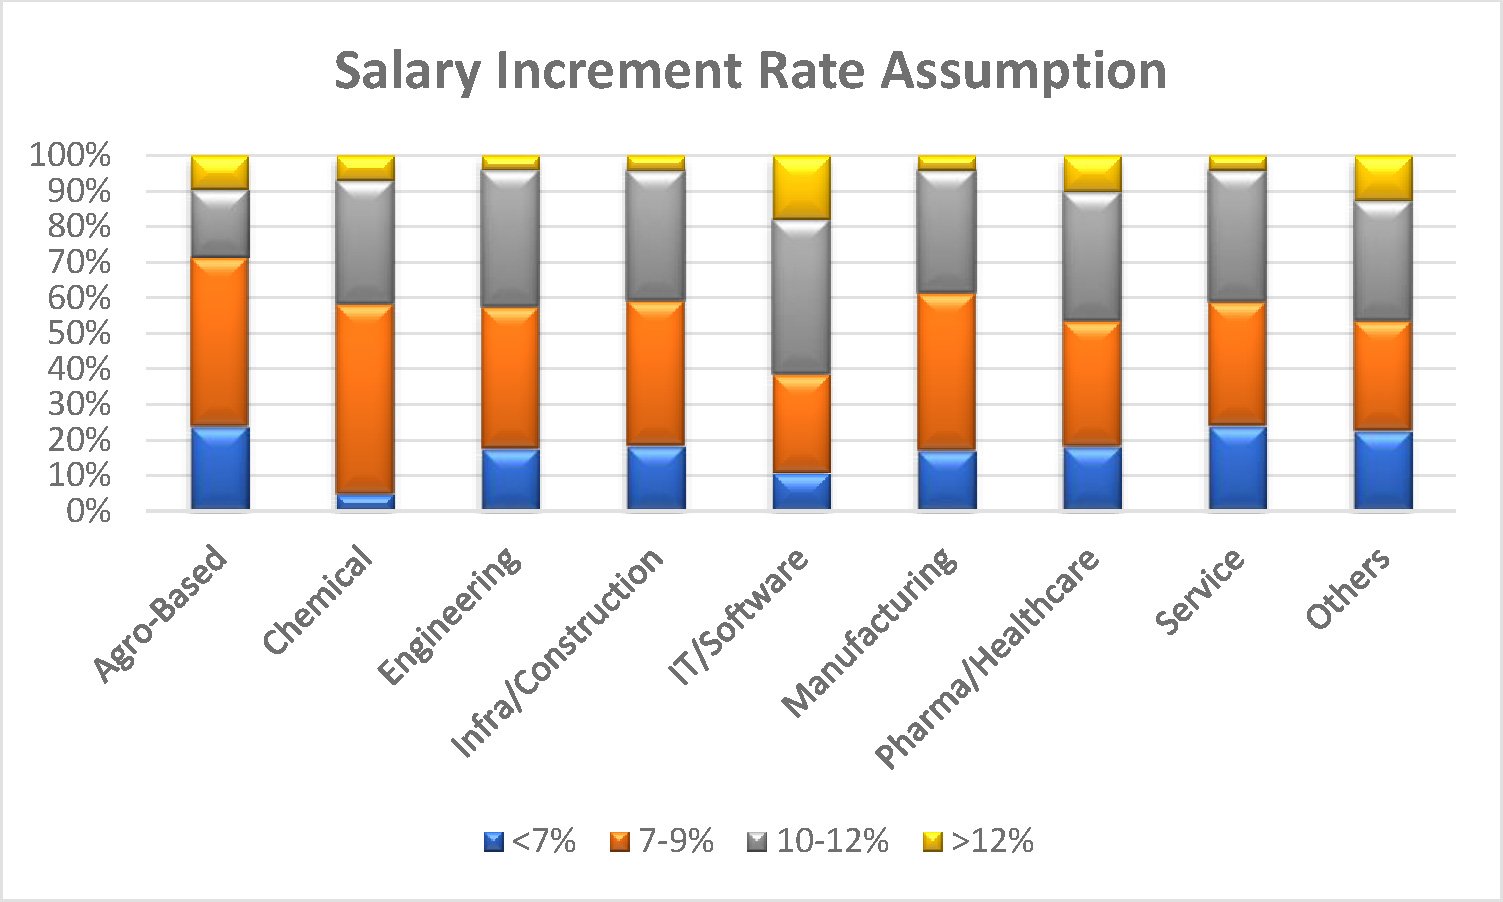
Figure 3
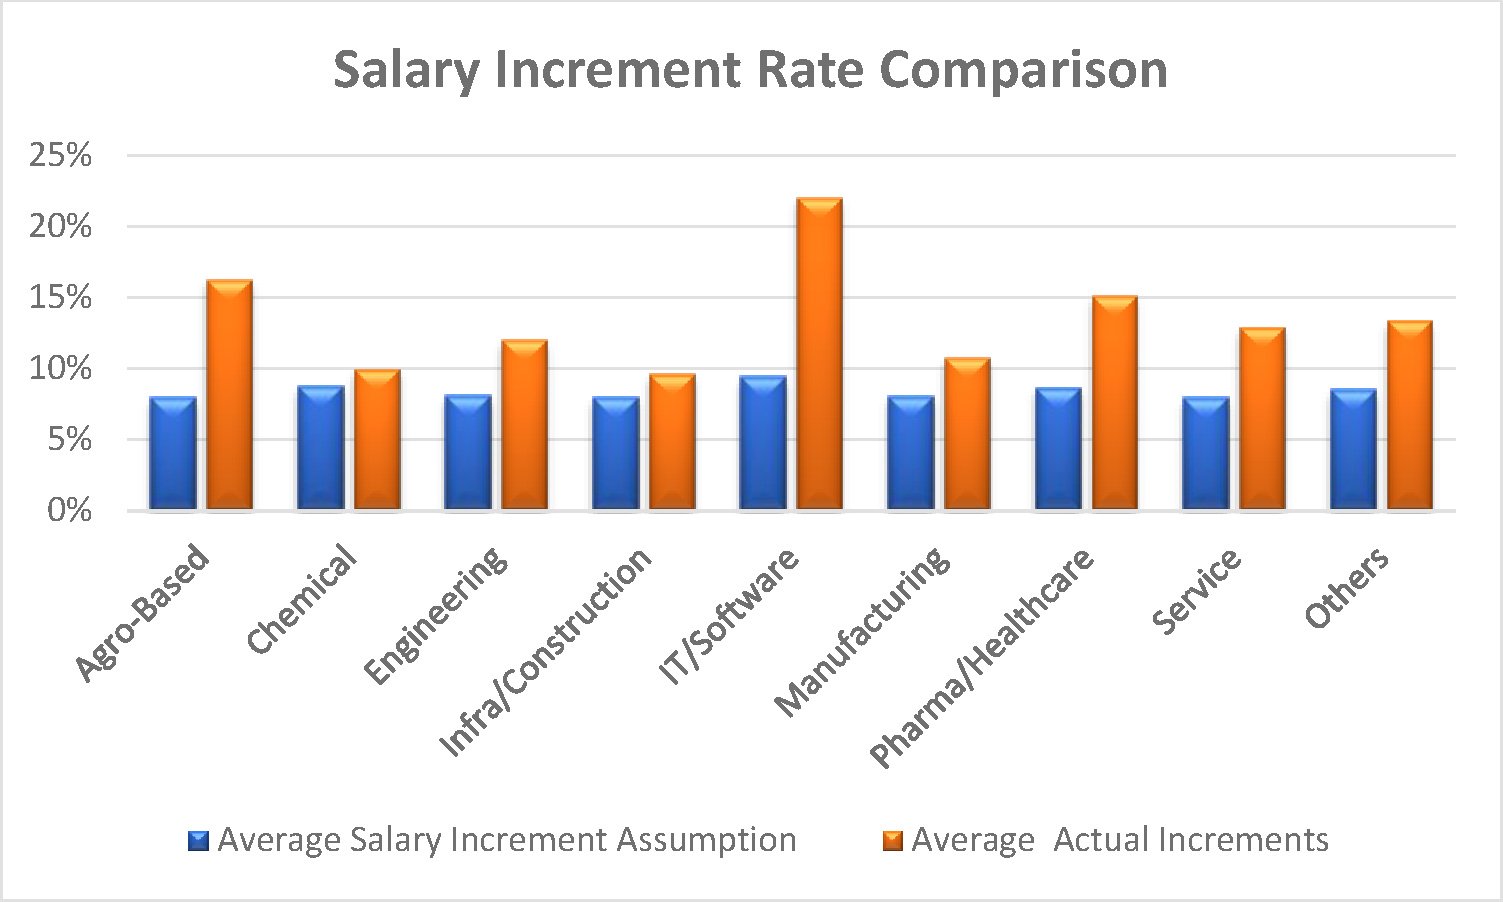
In Figure 4, we have plotted the industry-wise average assumption to actual salary increment rate. The gap between the two is higher for IT and agro-based sector. Sugar manufacturing companies, which are a part of agro-based data, have experienced higher salary increments this year. Since assumption should be based on a long-term view, companies may have chosen to go with a modest rate for the actuarial valuation. Moreover, most of the companies have given higher salary increments this year as there were very less or no salary increments (or even salary cuts) in FY 19-20 and 20-21 due to the Pandemic’s effect on businesses.
Figure 4
2. DEMOGRAPHIC ASSUMPTIONS
a) Attrition/Withdrawal Assumption
Attrition rate assumption is the expected employee turnover rate, and this assumption is used to project when the benefit will be payable in the event of resignation. It should be based on the company’s past attrition experience and future withdrawal expectations.
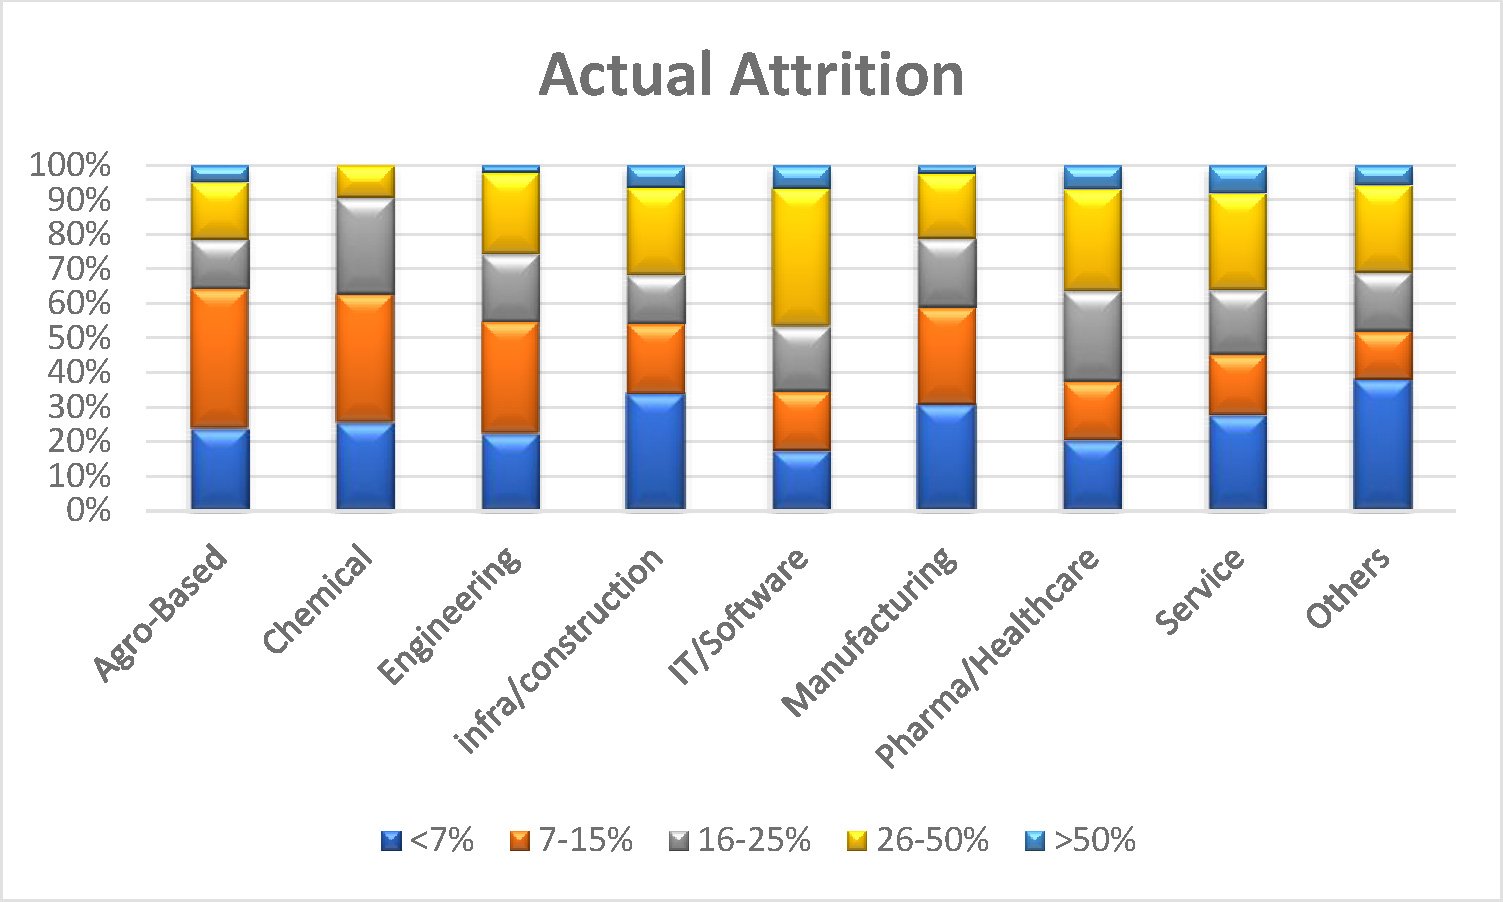
Figures 5 and 6 explain the industry wise distribution of attrition rate assumption and the actual attrition rate, respectively. As expected, the actual attrition rate is higher in IT and service industries; in the service category, actual attrition experienced by hospitality sector was higher. Manufacturing and chemical industries experienced lower attrition. Approximately 5% companies under review experienced actual attrition of more than 50%. The attrition rate assumptions of more than 25% was used by about 10% companies in IT and 15% companies in service industries.
Figure 5
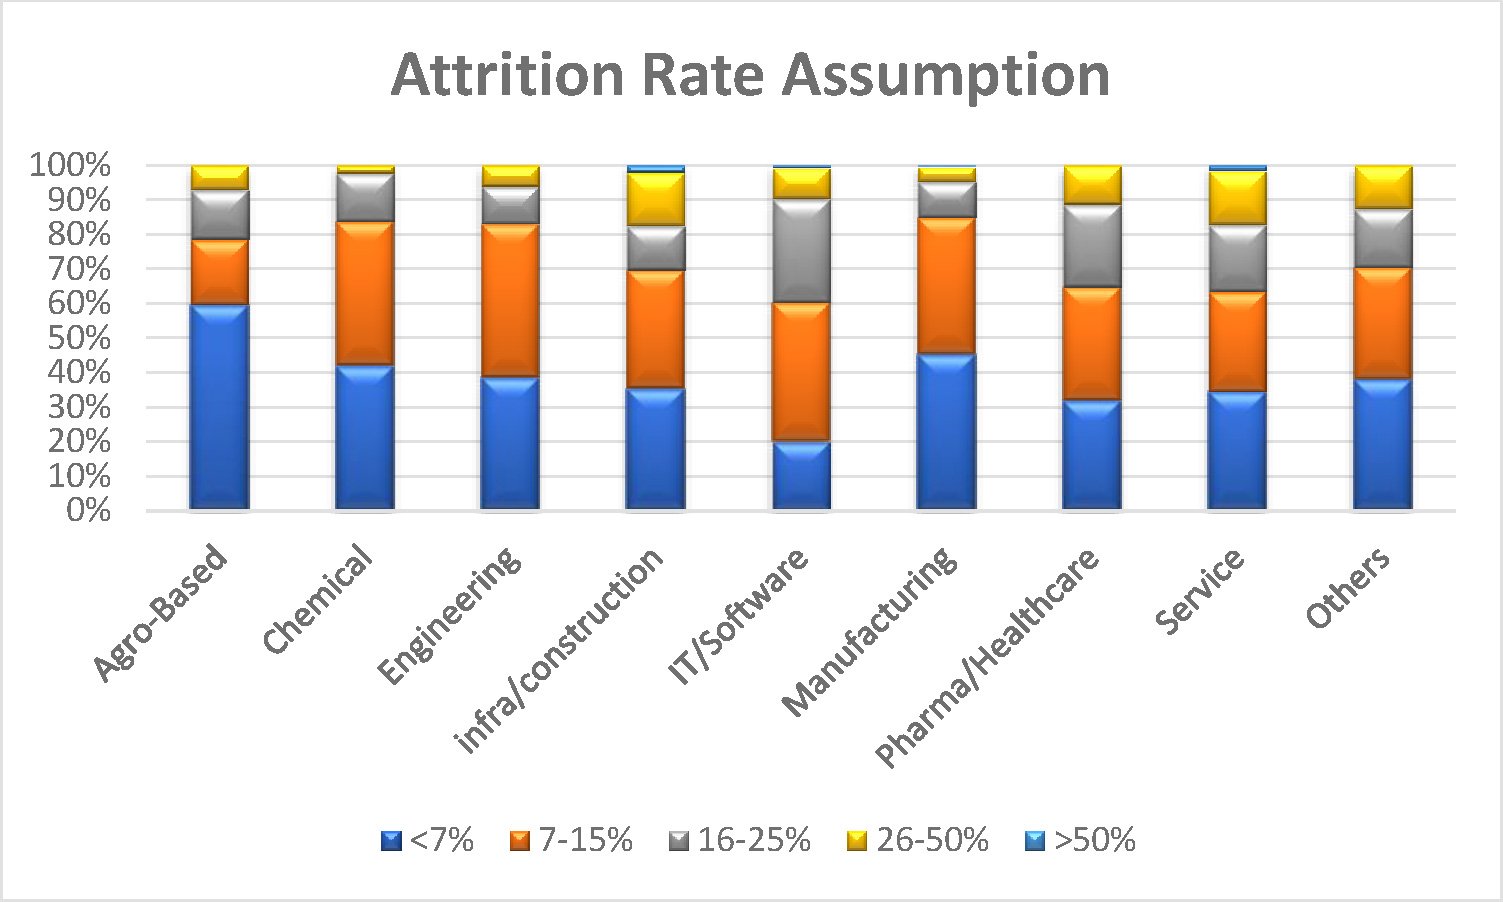
Figure 6
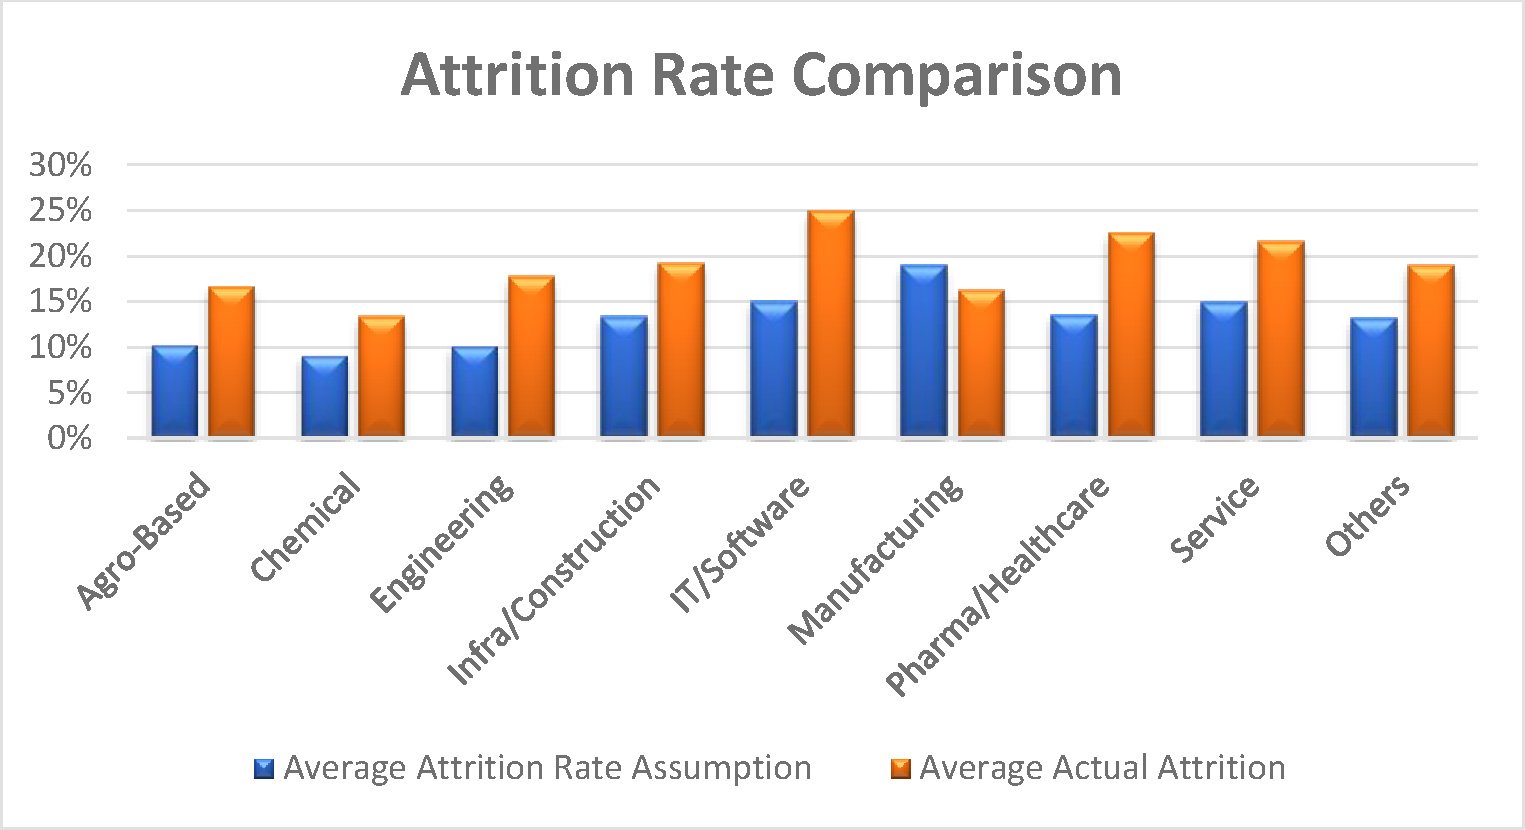
In Figure 7, which showsindustry-wise average attrition assumption to actual attrition rate, high actual attrition for IT, Pharma/Healthcare and service industries is seen which may be due to the involuntary resignations/lay-offs through the year.
Figure 7
b) Retirement Age
Retirement age is based on company’s policy and may vary across industries based on employee category. In our liability calculations, benefits are projected up to retirement age for each employee.
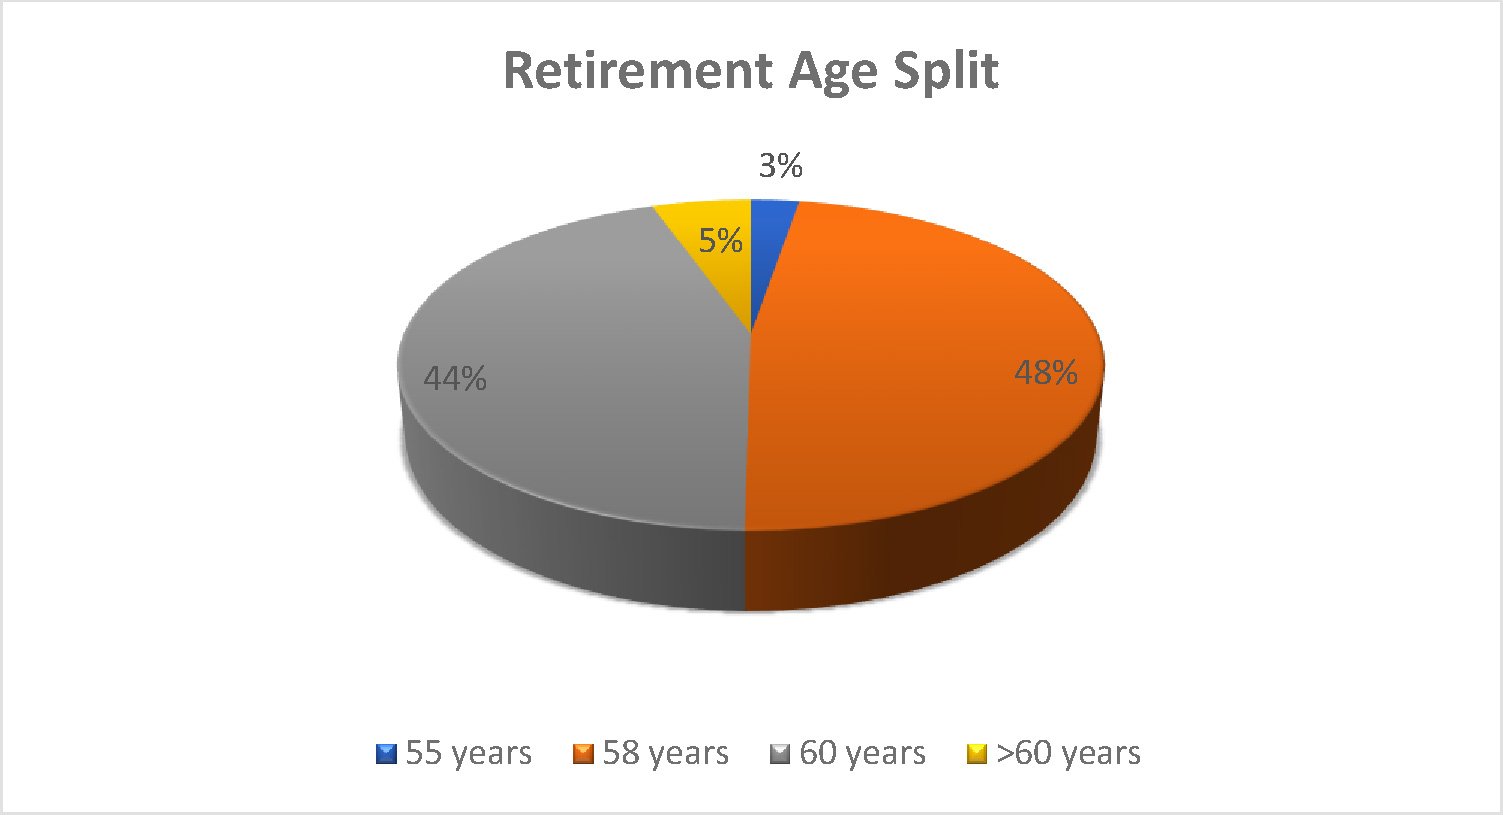
From Figure 8 it is seen that in most companies, retirement age ranges between 55 years to 65 years; 58 years and 60 years being more common across industries. Around 5% of the companies have retirement age of more than 60 years- mainly 65 years, which indicates a slow shift towards trend of developed countries, where retirement age of working force is increasing due to several factors like higher life expectancy, improved healthcare, financial sustainability of the pension funds etc.
Figure 8
3. Gratuity Plan Provisions specifics
Companies with more than 10 employees are required to make provision for Gratuity liability in balance sheet based on actuarial valuation irrespective of the vesting condition i.e. completion 5 years of service by an employee.
Companies mostly follow gratuity act while paying gratuity benefits to their employees. However, there are companies which pay more generously as compared to the gratuity act to retain their employees by altering the gratuity formula, vesting condition, or changing the cap on benefit amount. Below are some scheme variations under Gratuity from the database under study.
a) Gratuity formula
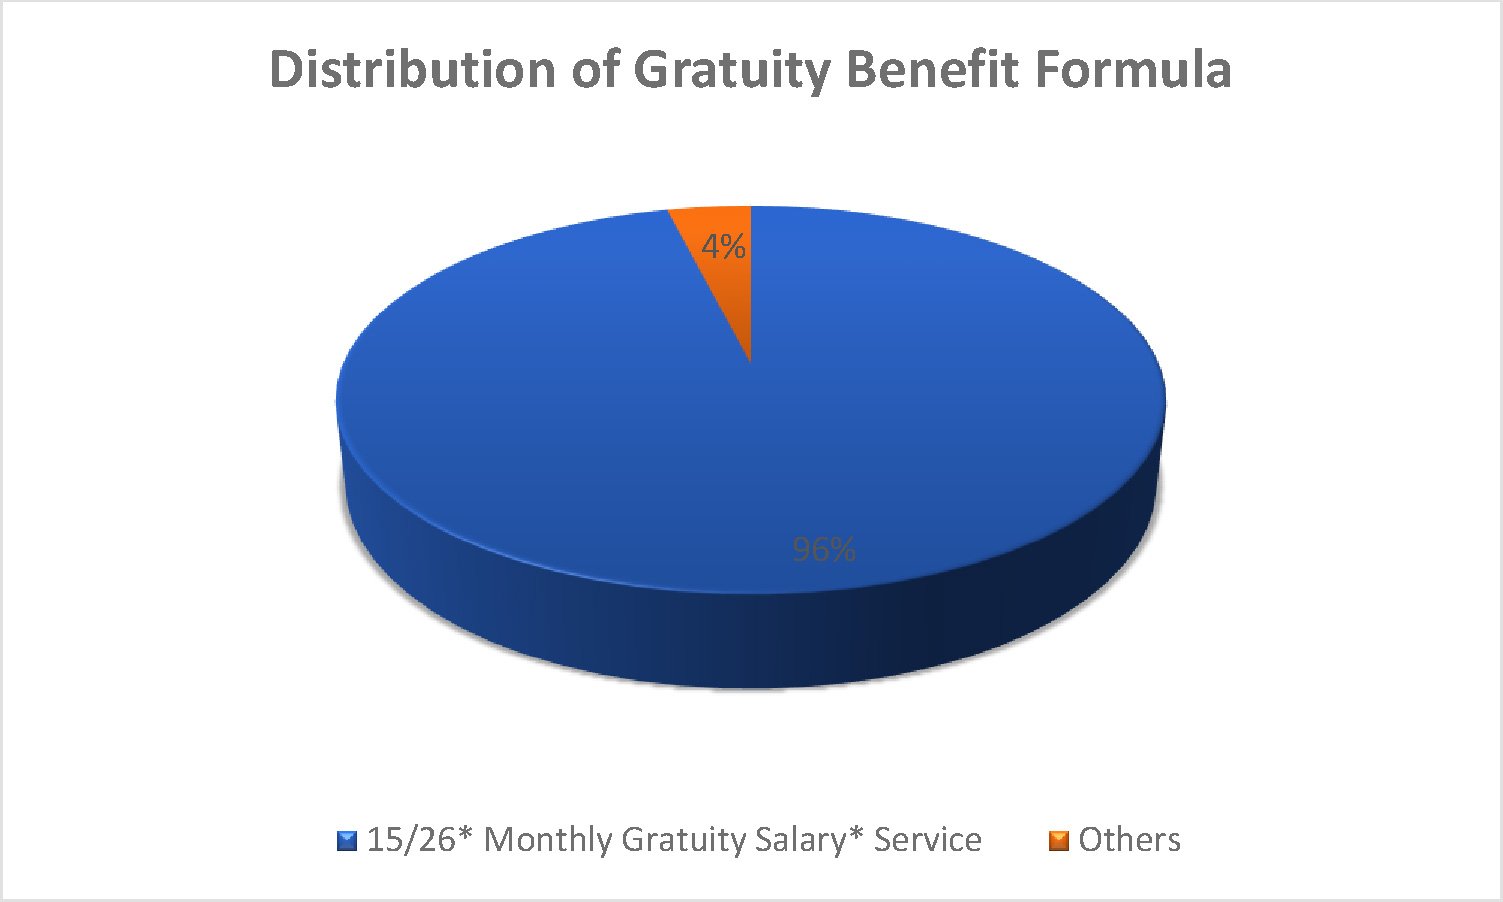
Figure 9 shows that majority of the companies provide gratuity benefit as per The Payment of Gratuity Act i.e., 15/26 x last drawn monthly gratuity salary x no. of years of completed service. Monthly gratuity salary used by most companies is same as Basic+ DA, as per the Gratuity Act.
Companies in the 4% category provide generous benefits compared to the minimum benefit payable as per the Gratuity Act, these are generally for employee retention or to acknowledge employees who stay longer in the company. For example, gratuity benefit provided in some cases based on ‘21/26 x last drawn monthly gratuity salary x service’ or ‘last drawn monthly gratuity salary x service’ etc.
Companies seldom provide gratuity benefit other than that specified by the Act. Due to revision of definition of ‘Wages’ in the new Wage Code, which is expected to be implemented in near future, most of the companies may stick to benefits prescribed by the code itself.
Figure 9
b) Cap/Ceiling on Gratuity benefit
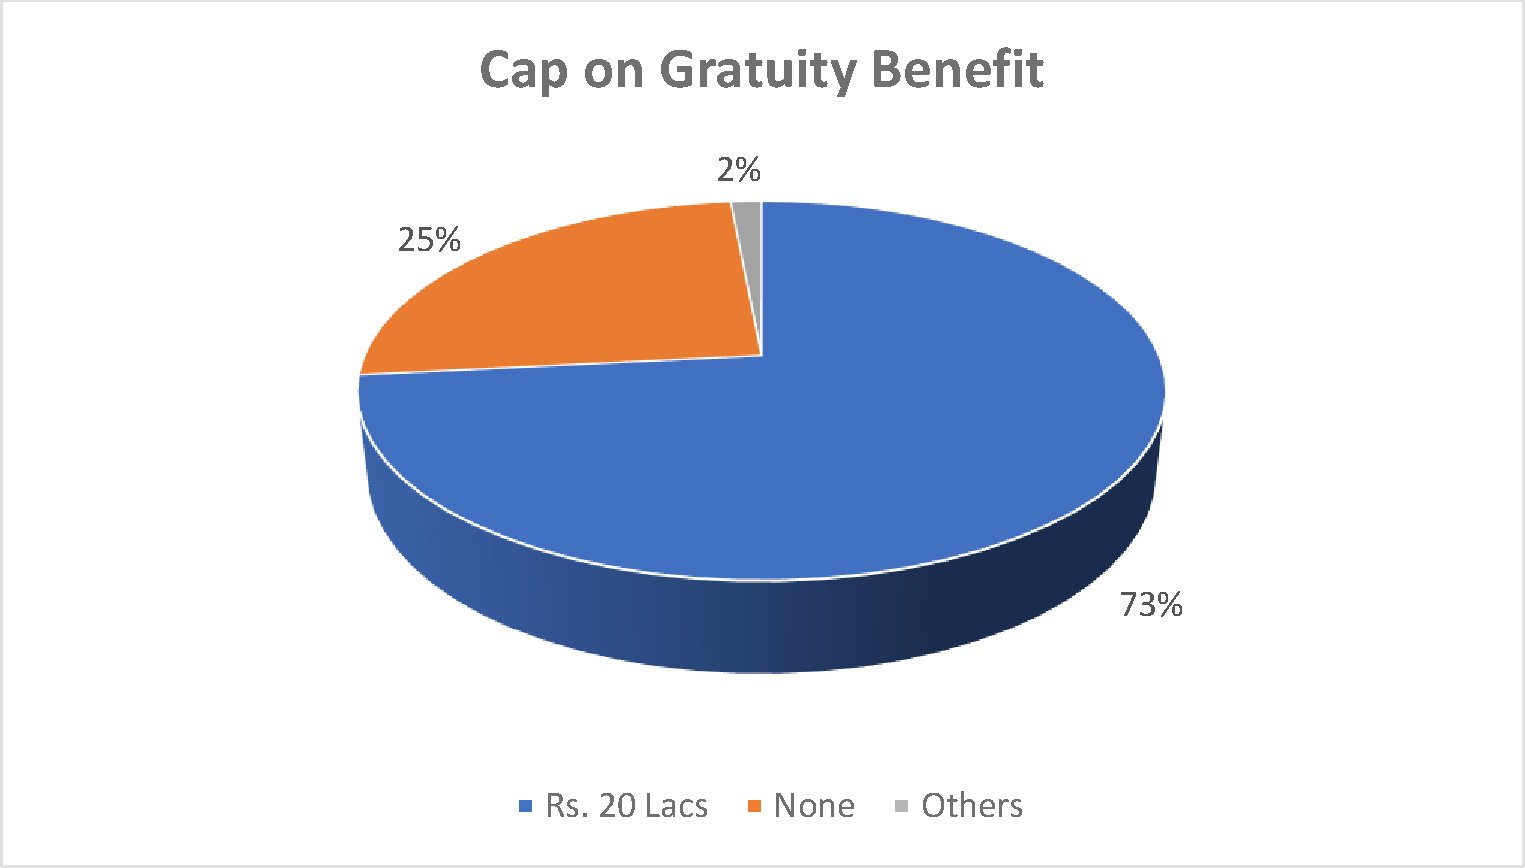
As per The Payment of Gratuity Act, maximum limit on gratuity benefit, which is tax exempt in the employees’ hand, is Rs. 20 lacs.
Figure 10 shows that almost 73% companies use cap on gratuity benefit of Rs. 20 lacs as per the Gratuity Act. 25% of the companies choose to pay uncapped gratuity liability, while a few companies cap the gratuity liability differently e.g. at 20 months’ salary.
Figure 10
4. Funding of Gratuity plans
Companies opt for trust fund with insurer/s mainly to secure employee benefits liabilities. Currently there are no funding regulations in India except some states like Andhra Pradesh where companies to whom Gratuity Act is applicable, must fund their gratuity liability. Fund values are shown as assets against employee benefits liabilities in the balance sheet. In the database under consideration, around 35% companies have funded gratuity schemes.
Figure 11 shows industry wise proportion of funded gratuity plans. Around 50% of engineering, agro-based and manufacturing companies have set up funds for their gratuity plans. A large proportion of companies in service, IT and pharma/healthcare industries have not funded their gratuity plans despite having a large employee base. It is expected that all companies with unfunded gratuity plans will be required to opt for a fund with an insurer/s on implementation of the new Wage Code.
Figure 11
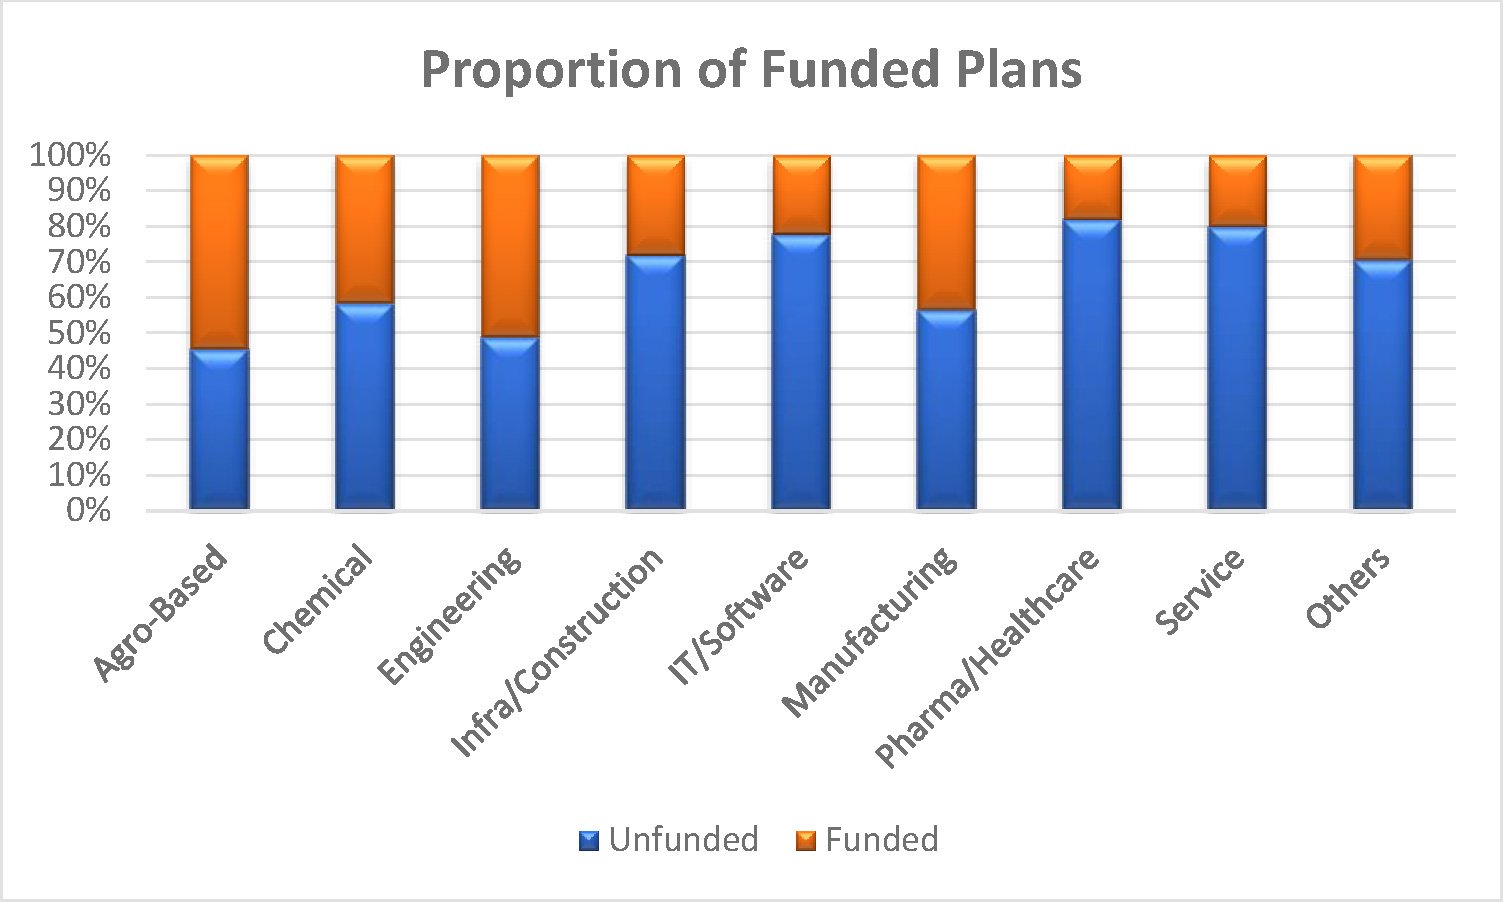
Figure 12 shows the percentage of gratuity actuarial liability that is covered by funds for FY 22-22. Funding ratio is calculated as closing fund value/closing gratuity liability. More than 50% of the companies have a funding ratio of more than or equal to 75%.
Figure 12
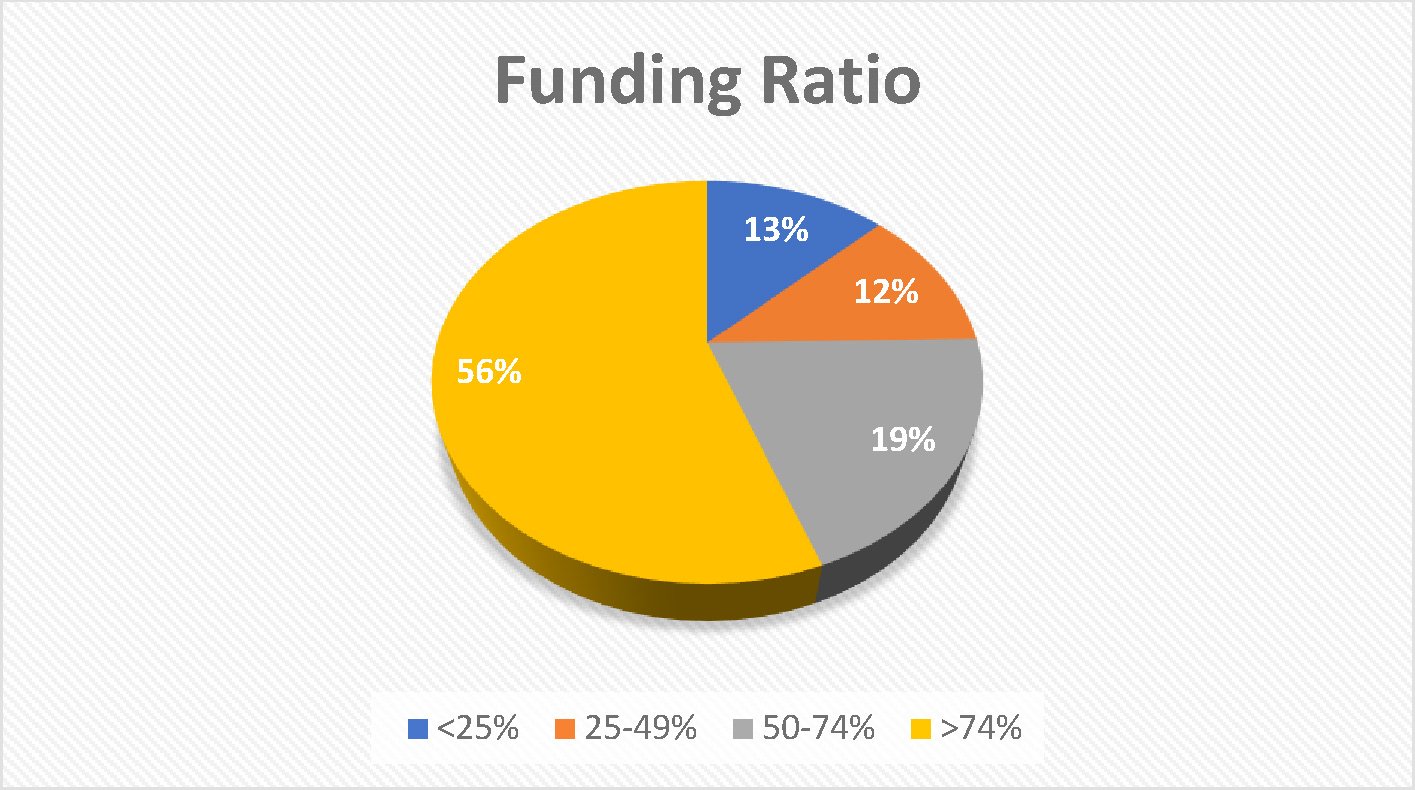
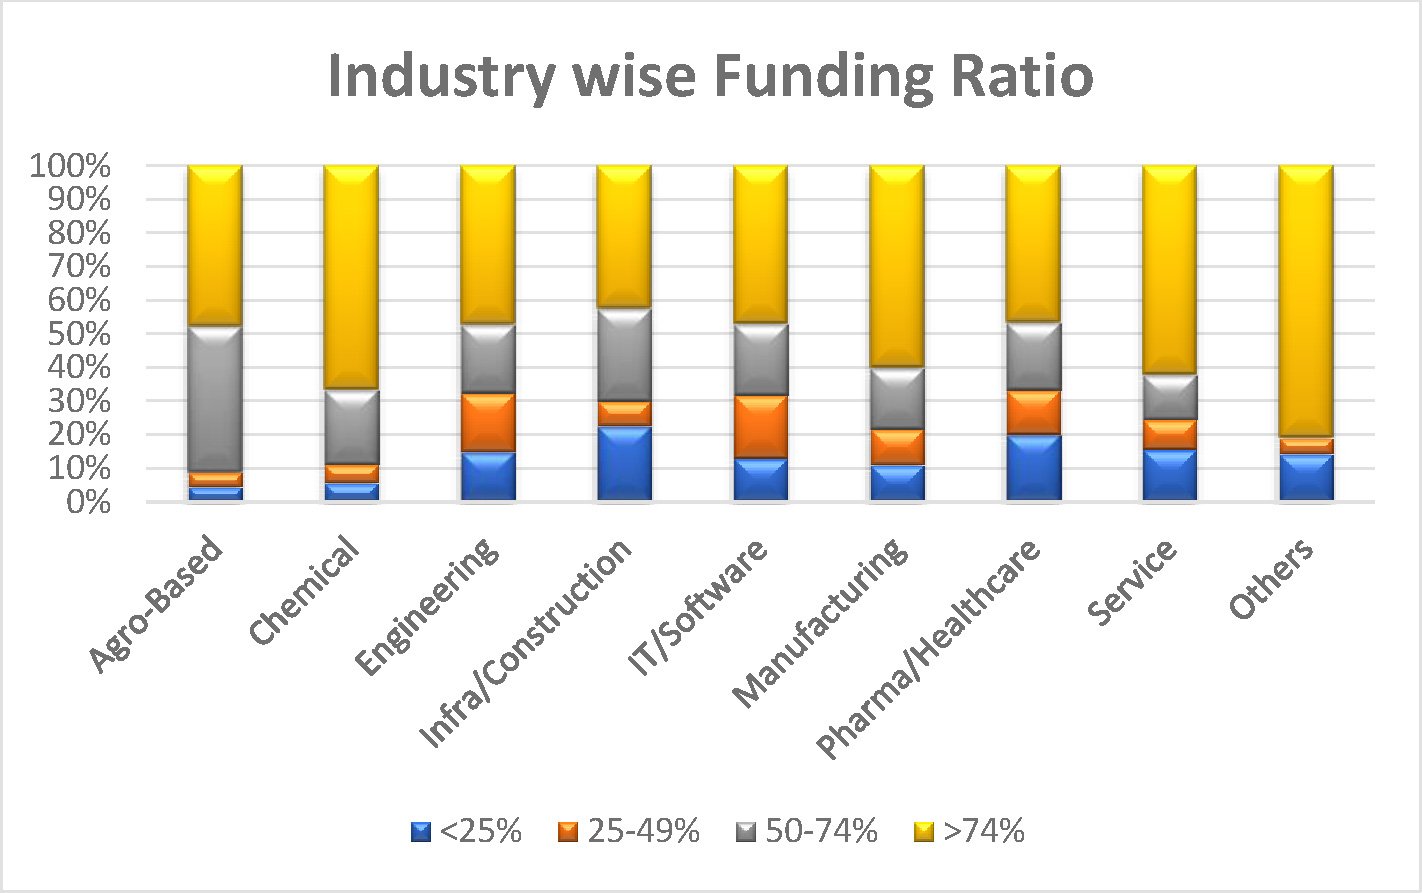
Figure 13 illustrates industry-wise funding ratios. For FY 21-22, approximately 50% companies have funded plans across all industries with an average assets-to-liability ratio of above 74%. Infra/construction and pharma/healthcare sector has around 20% companies which seem underfunded with ratio of less than 25%.
Figure 13
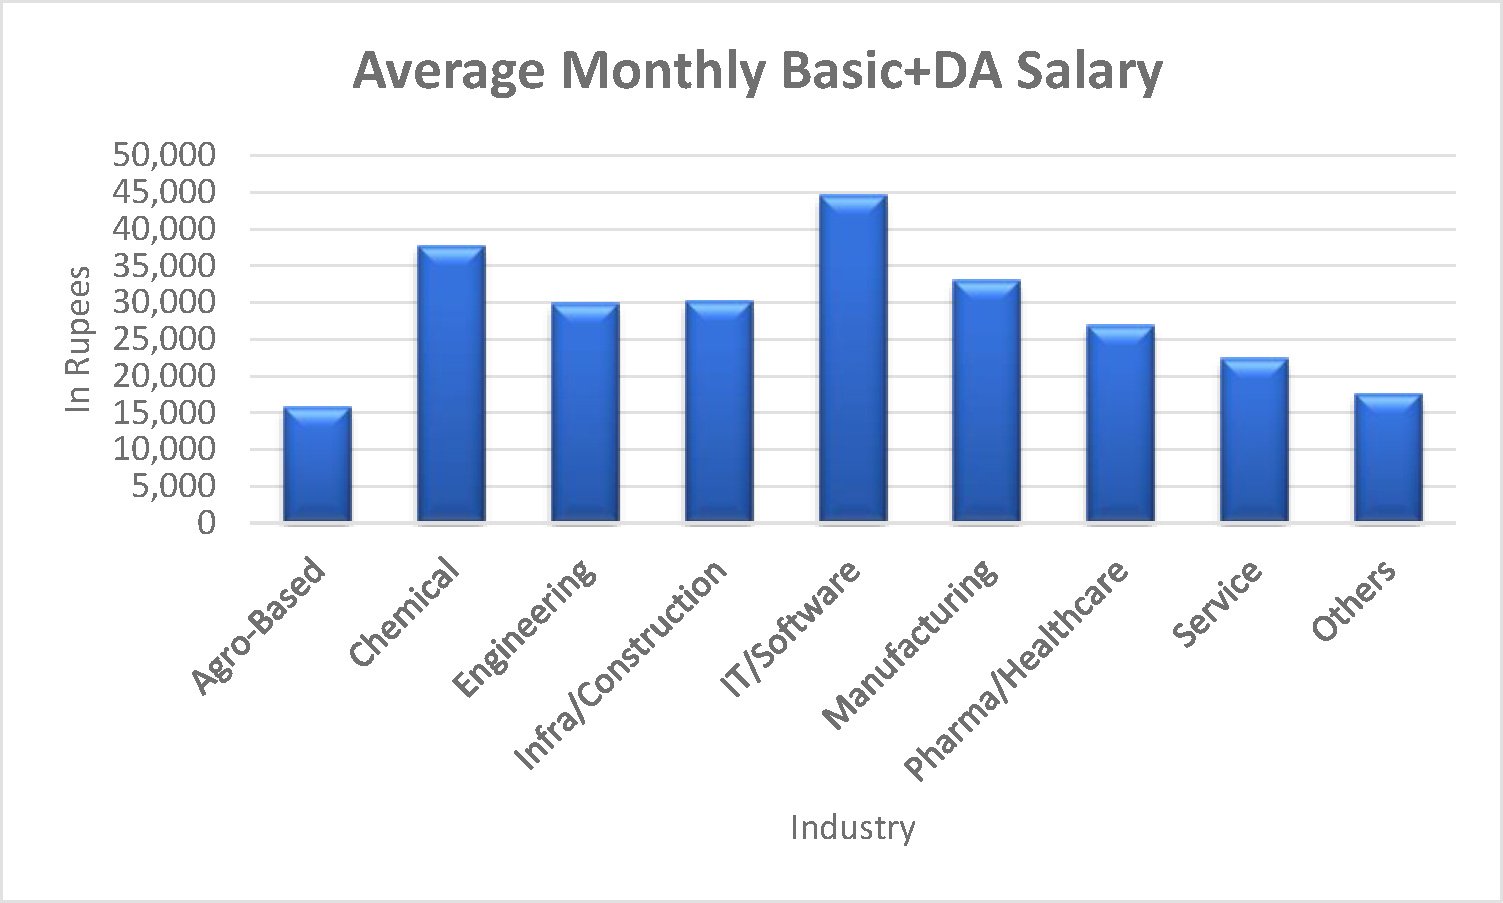
5. Average Salary trends among various industries
Industry-wise average salaries (Basic + DA) for FY 21-22 used for Gratuity valuation is plotted in Figure 14. Although salaries vary from company to company, some broad industry wise variations can be observed from the chart. For example – agro-based companies which primarily have unskilled labour have the lowest Basic+DA; whereas IT/software with highly skilled workforce provide the highest Basic+DA.
Figure 14
For FY 22-23 valuations, companies must undertake assumption studies to review actuarial assumptions and reset them based on this study along with their future expectations, not only to reduce volatility but also as a good governance policy.